
[OPGG] 데이터 시각화 및 apply
Updated:
1. 시각화
import numpy as np
import pandas as pd
import matplotlib.pyplot as plt
import seaborn as sns
import matplotlib as mpl

import requests

import warnings
warnings.filterwarnings("ignore")
%matplotlib inline
%config InlineBackend.figure_format = 'retina'

mpl.rc('font', family='NanumGothic') # 폰트 설정
mpl.rc('axes', unicode_minus=False) # 유니코드에서 음수 부호 설정

# 차트 스타일 설정
sns.set(font="NanumGothic", rc={"axes.unicode_minus":False}, style='darkgrid')
plt.rc("figure", figsize=(10,8))
plt.plot([1, 2, 3, 5 ,8])
plt.ylabel("numbers")
plt.show()
# subplot
alphabet = ["a", "b", "c"]
values = [1, 50, 100]

plt.figure(figsize=(12,4))

plt.subplot(131)
plt.bar(alphabet, values)

plt.subplot(1,3,2)
plt.scatter(alphabet, values)

plt.subplot(1,3,3)
plt.plot(alphabet, values)

plt.suptitle("Categorical Plotting")
plt.show()
data = pd.read_csv("Day09_01_BIPA_data.csv", index_col=0)
# 일부 챔피언에 대한 평균값 정보 (10개가 아닌 9개의 챔피언 id 0은 없음)
data1_10 = data[data['championId'].isin(range(0,10))]
group1_10 = data1_10.groupby("championId", as_index=False).mean()
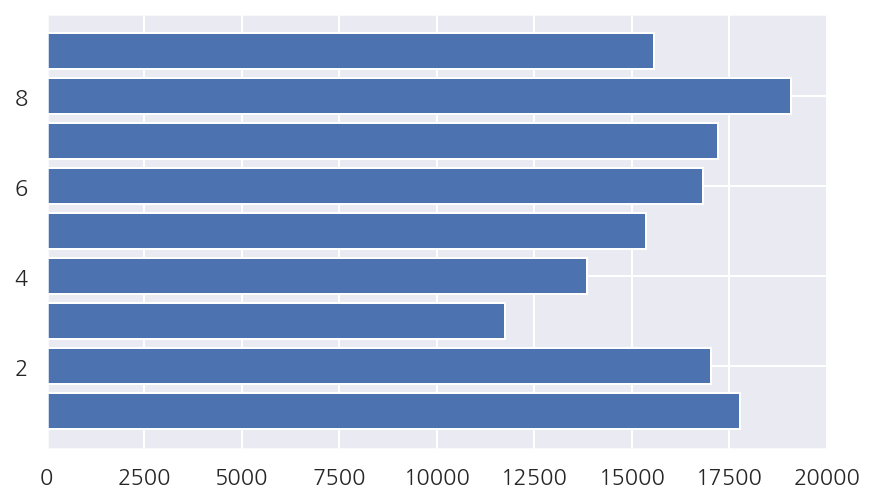
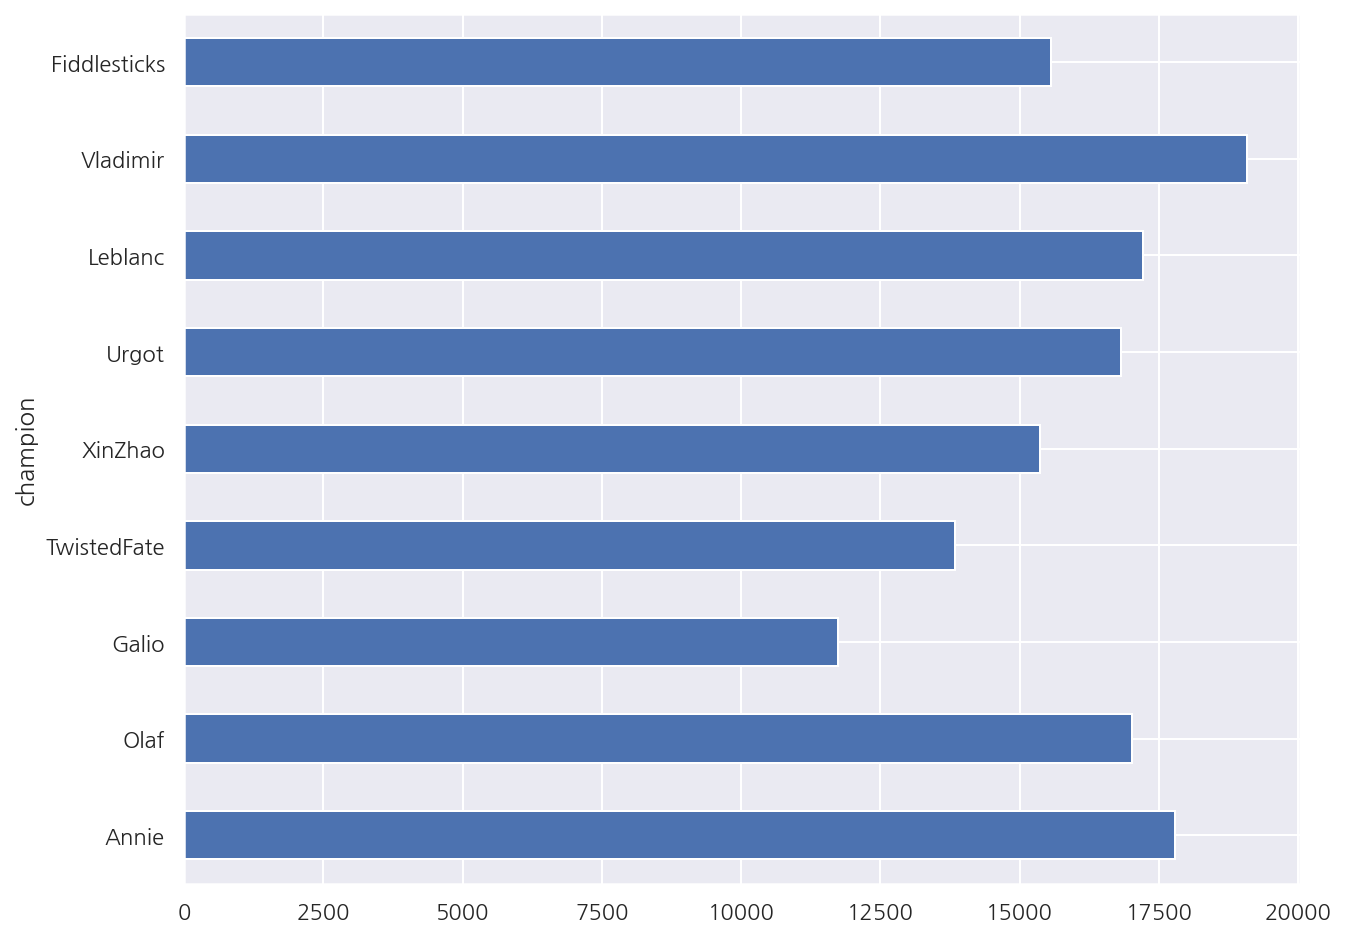
# 챔피언별 총 딜량
fig, ax = plt.subplots(figsize=(7,4))

ax.barh(group1_10['championId'], group1_10['totalDamageDealtToChampions'])
fig.show()
# 각 버전 (챔피언, 룬, 아이템 등..)
champ_ver = requests.get('https://ddragon.leagueoflegends.com/realms/na.json').json()['n']['champion']
championJsonURL = 'http://ddragon.leagueoflegends.com/cdn/' + champ_ver + '/data/en_US/champion.json'

# 챔피언 정보 url
request = requests.get(championJsonURL)
champion_data = request.json()
champion_data.keys()
dict_keys(['type', 'format', 'version', 'data'])
# 챔피언 id, name 데이터 프레임
champion_dict = {}

for c_name in champion_data['data'].keys() :
    champion_dict[int(champion_data['data'][c_name]['key'])]=c_name

champion = pd.DataFrame.from_dict(champion_dict, orient = 'index', columns = ['champion'])
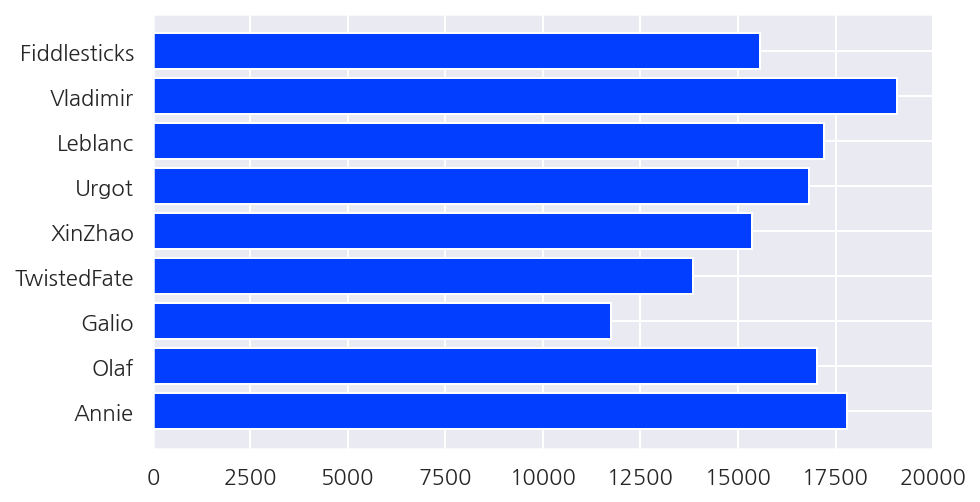
# merge, 챔피언 이름 추가
group1_10 = pd.merge(group1_10, champion, left_on="championId", right_index=True)
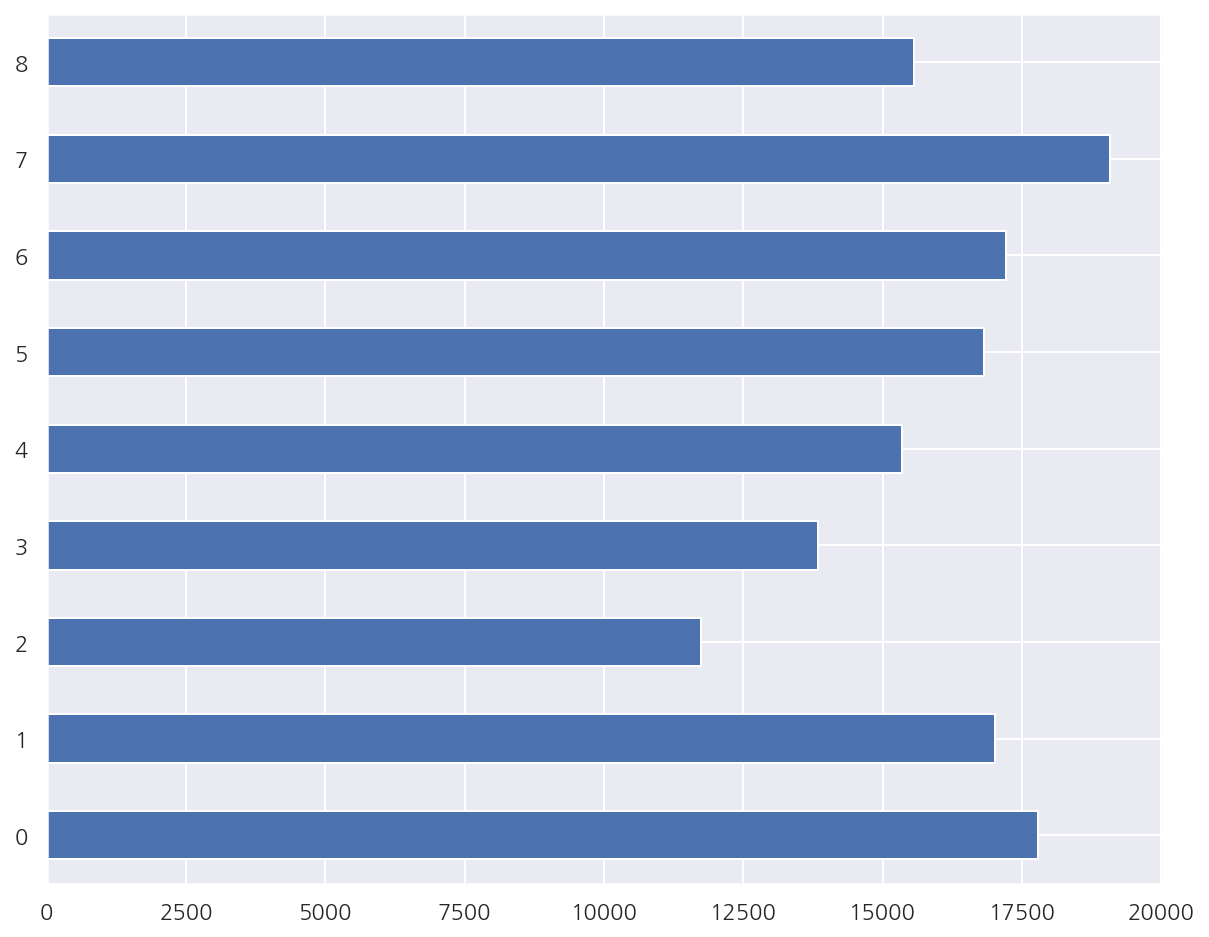
# 챔피언 이름으로 y축 변경
fig, ax = plt.subplots(figsize=(7,4))

ax.barh(group1_10['champion'], group1_10['totalDamageDealtToChampions'])
fig.show()

# pandas에서 plot
group1_10['totalDamageDealtToChampions'].plot(kind='barh')
plt.show()
# index 변경
group1_10.index = group1_10.champion
group1_10['totalDamageDealtToChampions'].plot(kind='barh')
plt.show()
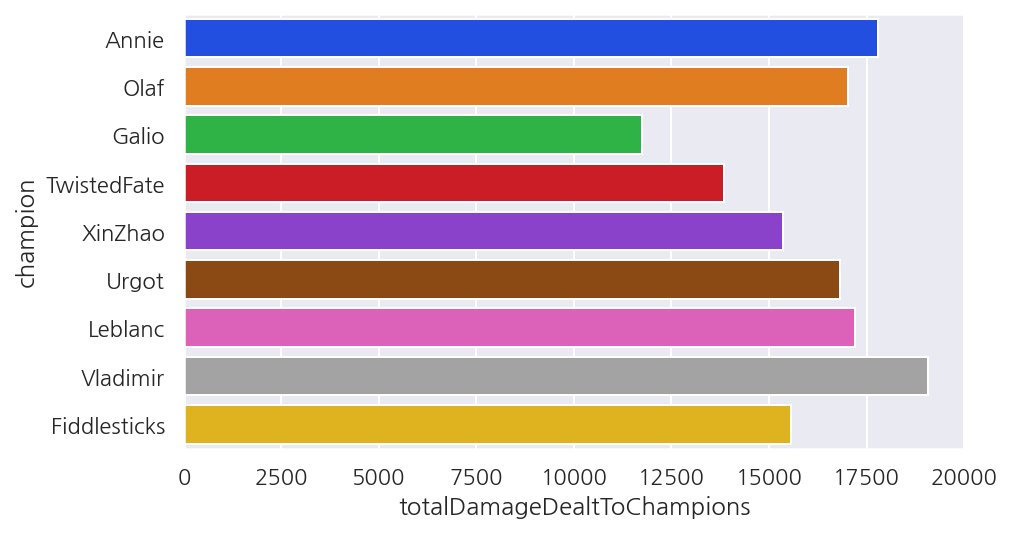
# color 스타일 변경 (영구)
sns.set_palette('bright')

fig, ax = plt.subplots(figsize=(7,4))

ax.barh(group1_10['champion'], group1_10['totalDamageDealtToChampions'])
fig.show()
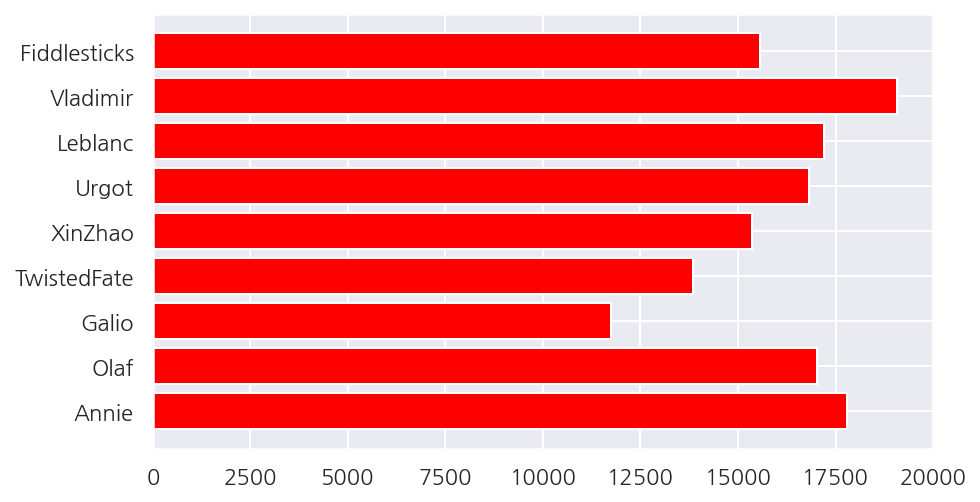
# color 변경
sns.set_palette('bright')

fig, ax = plt.subplots(figsize=(7,4))

ax.barh(group1_10['champion'], group1_10['totalDamageDealtToChampions'], color="red")
fig.show()
# seaborn
fig, ax = plt.subplots(figsize=(7,4))

sns.barplot(data=group1_10, x='totalDamageDealtToChampions', y='champion')
plt.show()
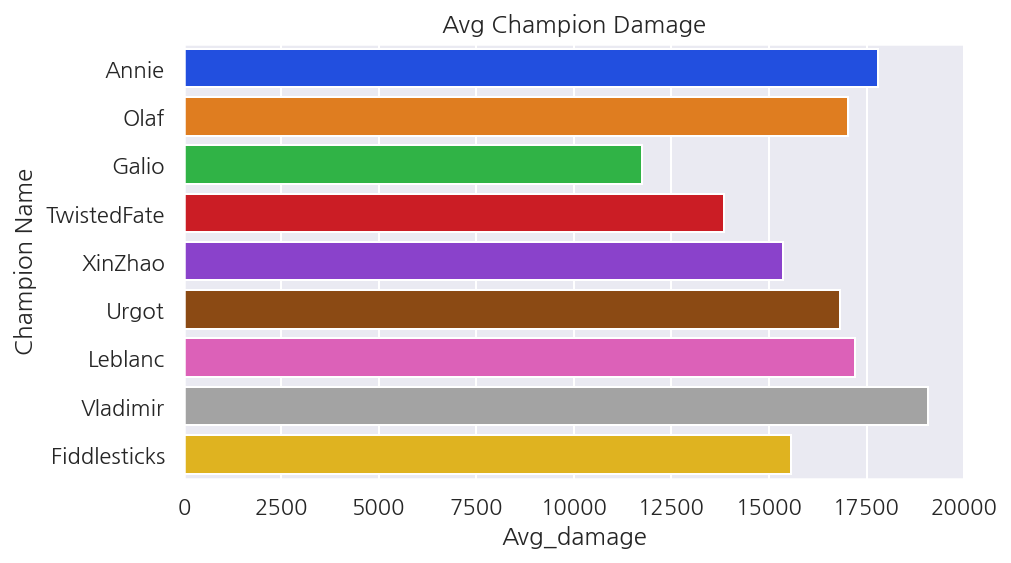
# xlabel, ylabel, title
fig, ax = plt.subplots(figsize=(7,4))

sns.barplot(data=group1_10, x='totalDamageDealtToChampions', y='champion')

ax.set_xlabel("Avg_damage")
ax.set_ylabel("Champion Name")
ax.set_title("Avg Champion Damage")

plt.show()
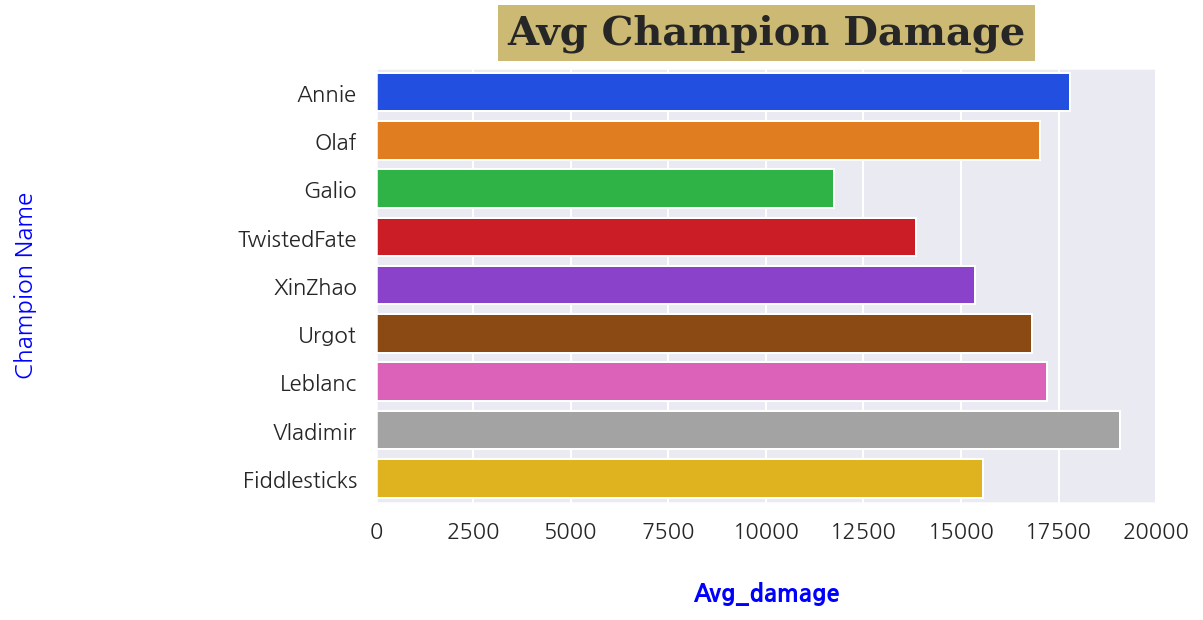
# font style
font_label = {
    'color': 'blue',
    'weight': 'bold'
}

font_title = {
    'family': 'serif',
    'size': 20,
    'backgroundcolor': 'y',
    'weight': 'bold',
    'verticalalignment': 'baseline',
    'horizontalalignment': 'center'
}

fig, ax = plt.subplots(figsize=(7,4))

sns.barplot(data=group1_10, x='totalDamageDealtToChampions', y='champion')

# pad 옵션은 축과의 거리 옵션
ax.set_xlabel("Avg_damage", fontdict=font_label, labelpad=20)
ax.set_ylabel("Champion Name", color='blue', labelpad=100)
ax.set_title("Avg Champion Damage", fontdict=font_title, pad=12)

plt.show()
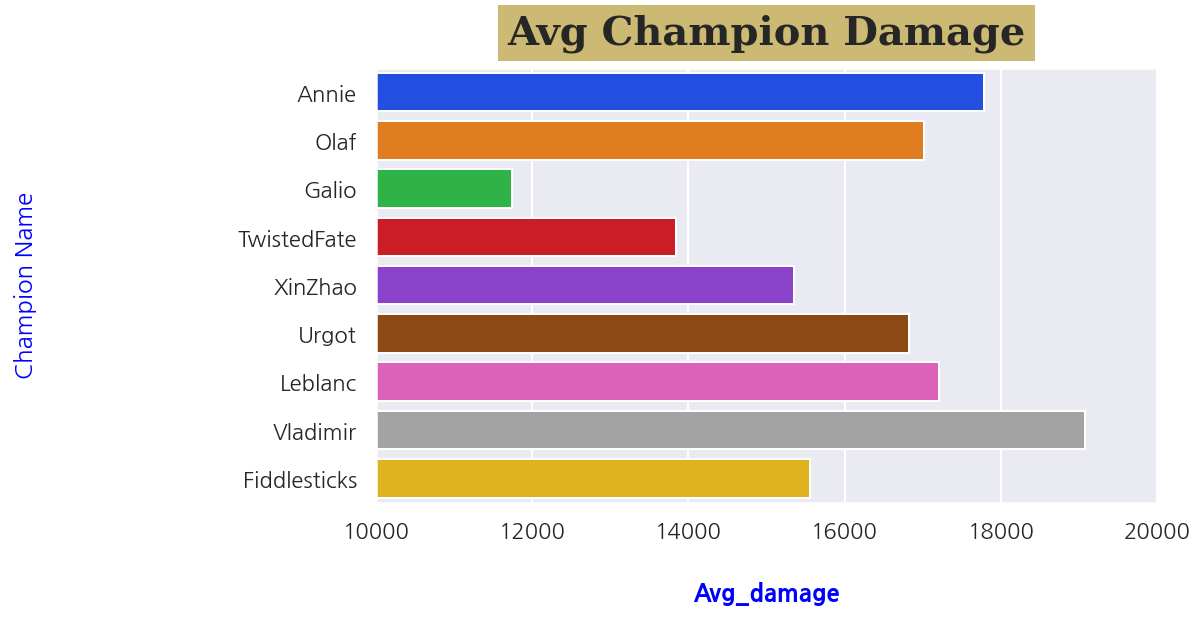
# font style
font_label = {
    'color': 'blue',
    'weight': 'bold'
}

font_title = {
    'family': 'serif',
    'size': 20,
    'backgroundcolor': 'y',
    'weight': 'bold',
    'verticalalignment': 'baseline',
    'horizontalalignment': 'center'
}

fig, ax = plt.subplots(figsize=(7,4))

sns.barplot(data=group1_10, x='totalDamageDealtToChampions', y='champion')

# pad 옵션은 축과의 거리 옵션
ax.set_xlabel("Avg_damage", fontdict=font_label, labelpad=20)
ax.set_ylabel("Champion Name", color='blue', labelpad=100)
ax.set_title("Avg Champion Damage", fontdict=font_title, pad=12)

# x축 범위 설정
ax.set_xlim(10000, 20000)

plt.show()
# font style
font_label = {
'color': 'blue',
'weight': 'bold'
}
font_title = {
'family': 'serif',
'size': 20,
'backgroundcolor': 'y',
'weight': 'bold',
'verticalalignment': 'baseline',
'horizontalalignment': 'center'
}
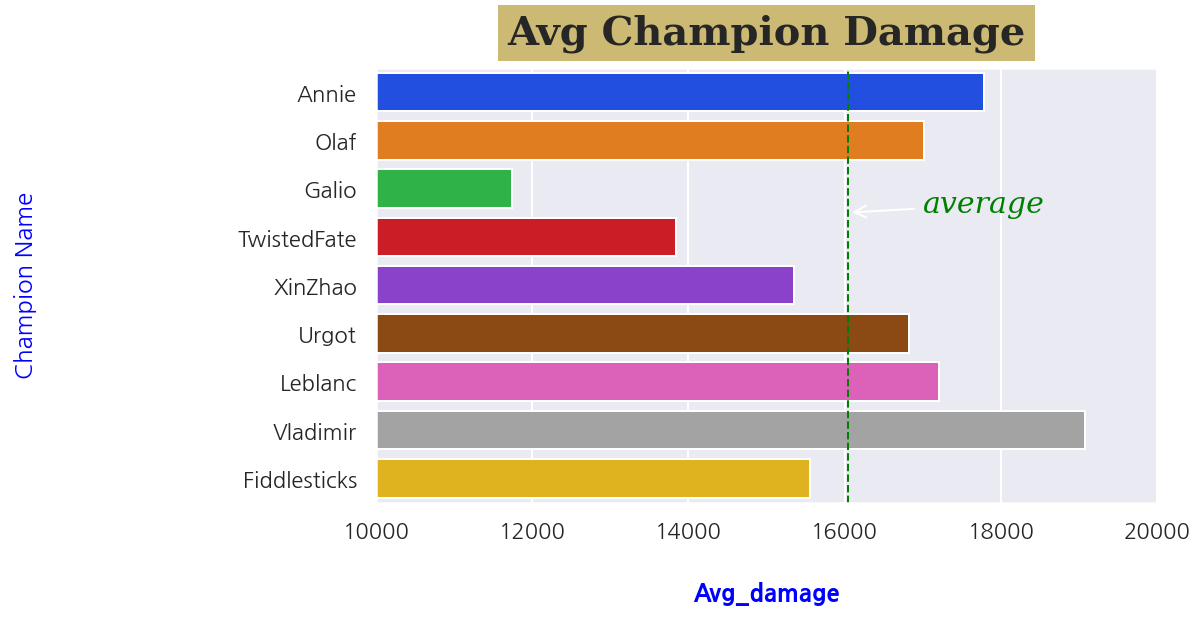
fig, ax = plt.subplots(figsize=(7,4))
sns.barplot(data=group1_10, x='totalDamageDealtToChampions', y='champion')
# pad 옵션은 축과의 거리 옵션
ax.set_xlabel("Avg_damage", fontdict=font_label, labelpad=20)
ax.set_ylabel("Champion Name", color='blue', labelpad=100)
ax.set_title("Avg Champion Damage", fontdict=font_title, pad=12)
# x축 범위 설정
ax.set_xlim(10000, 20000)
ax.axvline(damage_mean, ls='--', lw=1, color='green')
# 평균값 선 추가해주기
damage_mean = group1_10['totalDamageDealtToChampions'].mean()
ax.axvline(damage_mean, ls='--', lw=1, color='green')
# 화살표 추가
arrowprops = {
'arrowstyle': '->'
}
ax.annotate("average", (damage_mean, 2.5), xytext=(17000,2.5), color='green',
fontfamily='serif', fontstyle='italic', fontsize=15, arrowprops = arrowprops)
plt.show()
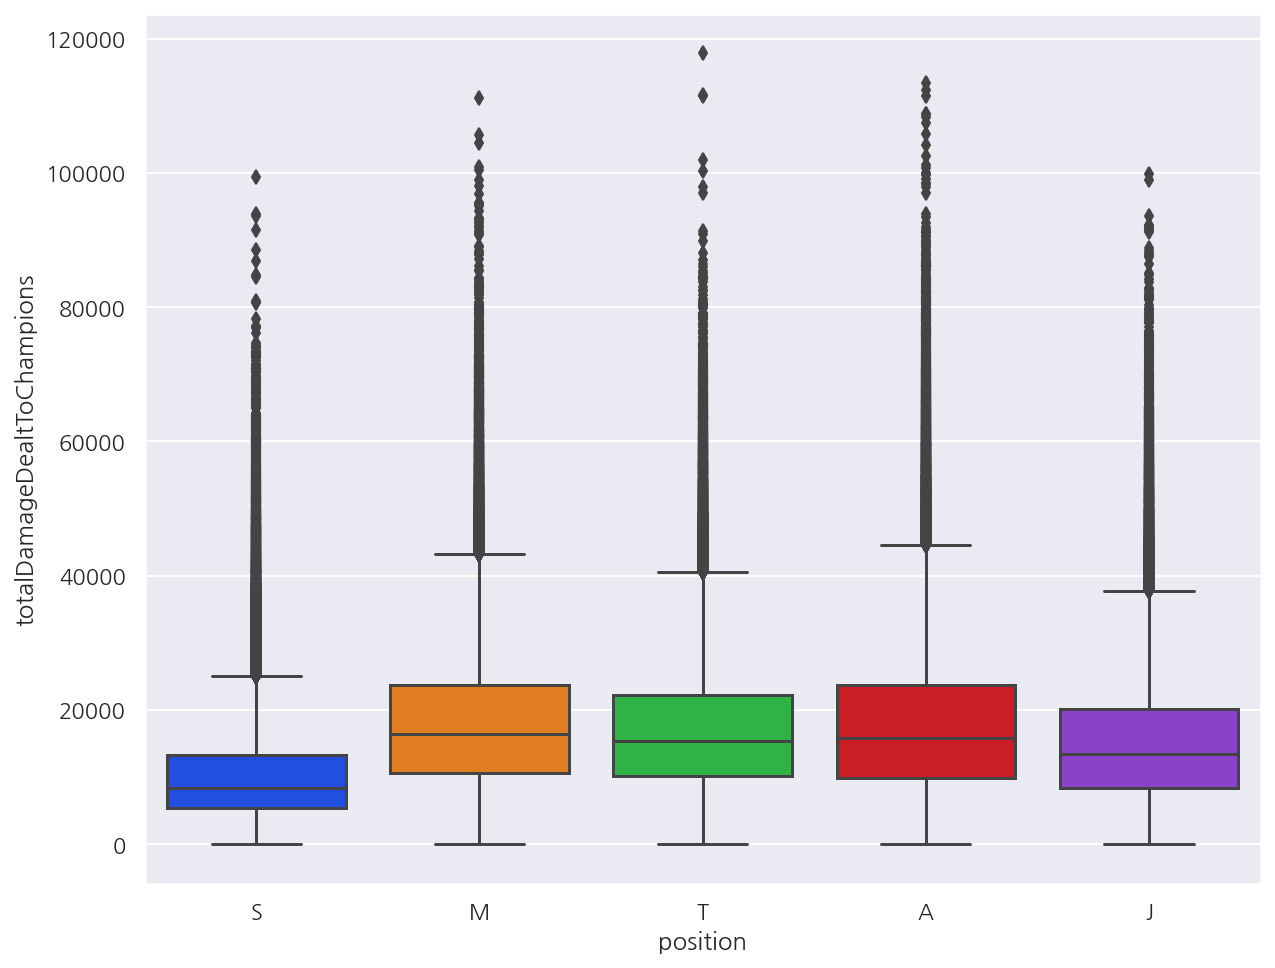
# boxplot
sns.boxplot(y = data['totalDamageDealtToChampions'], x = data['position'])
plt.show()
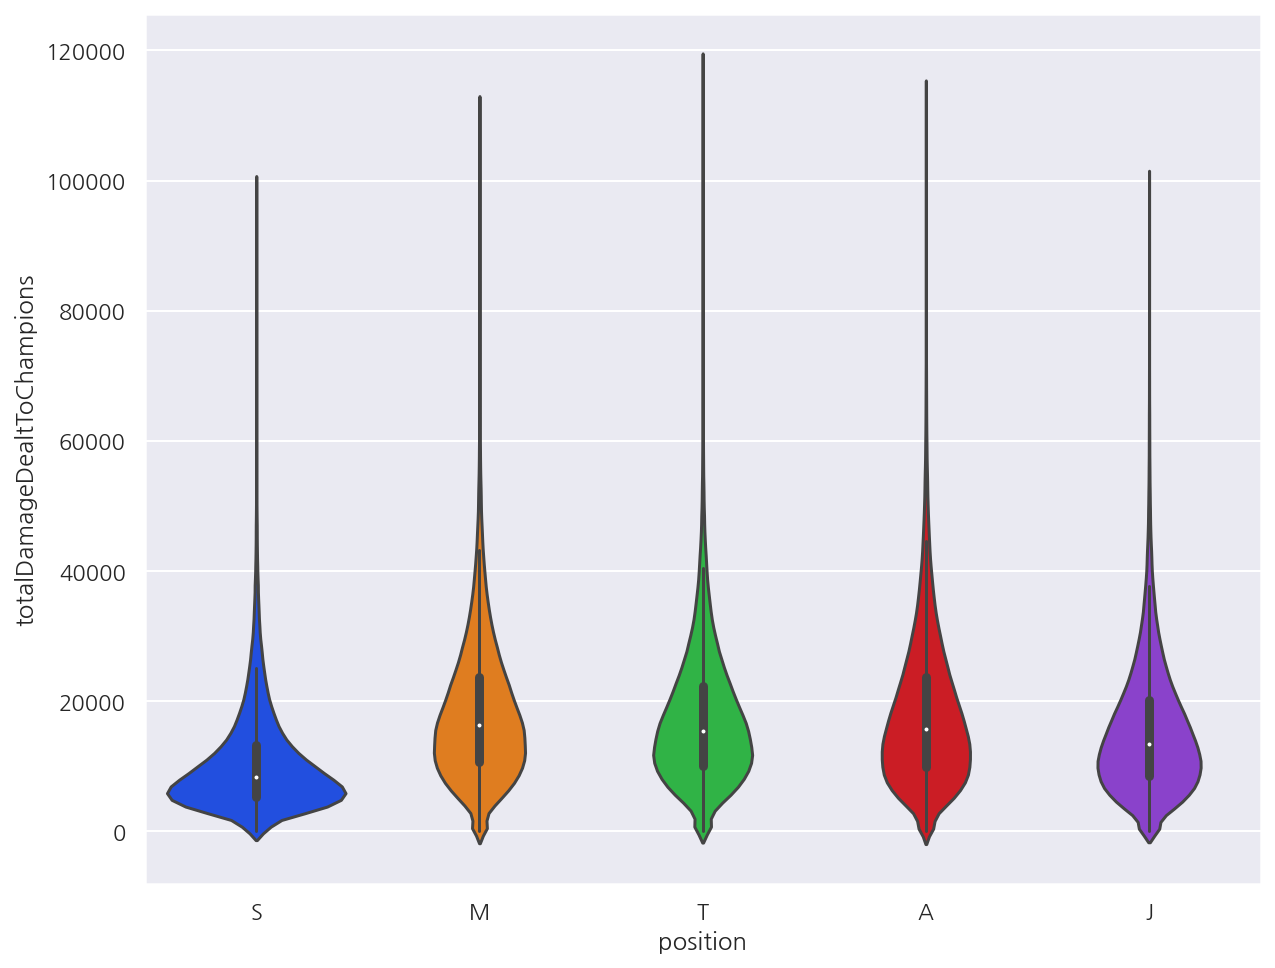
# boxplot
sns.violinplot(y = data['totalDamageDealtToChampions'], x = data['position'])
plt.show()
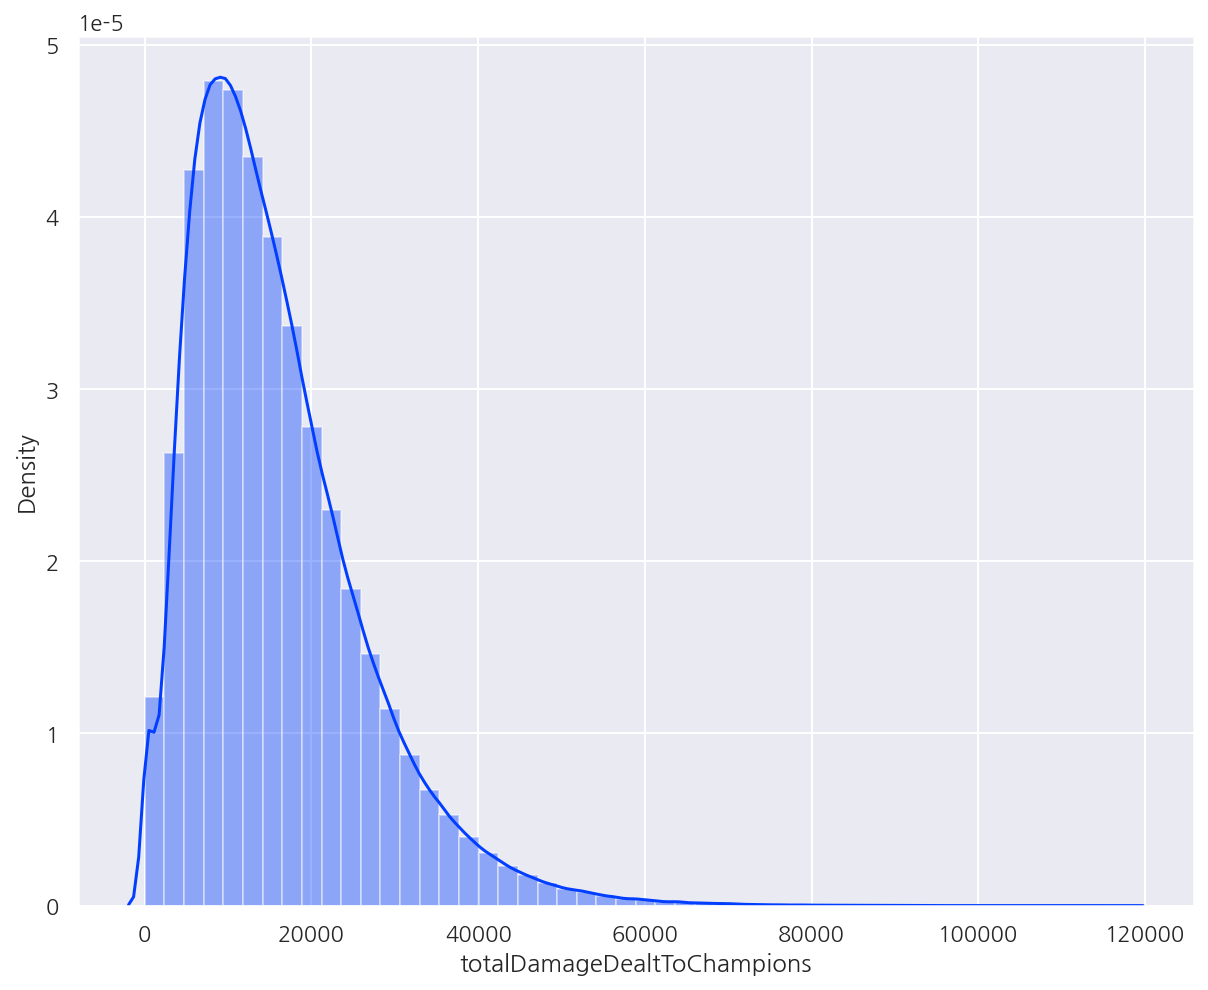
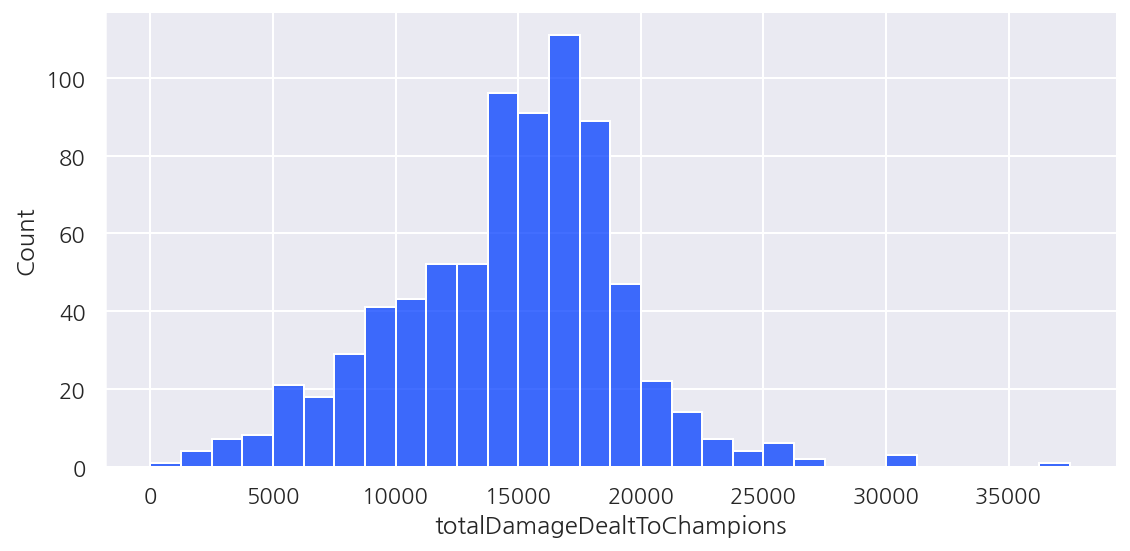
# distplot
sns.distplot(data['totalDamageDealtToChampions'])
plt.show()
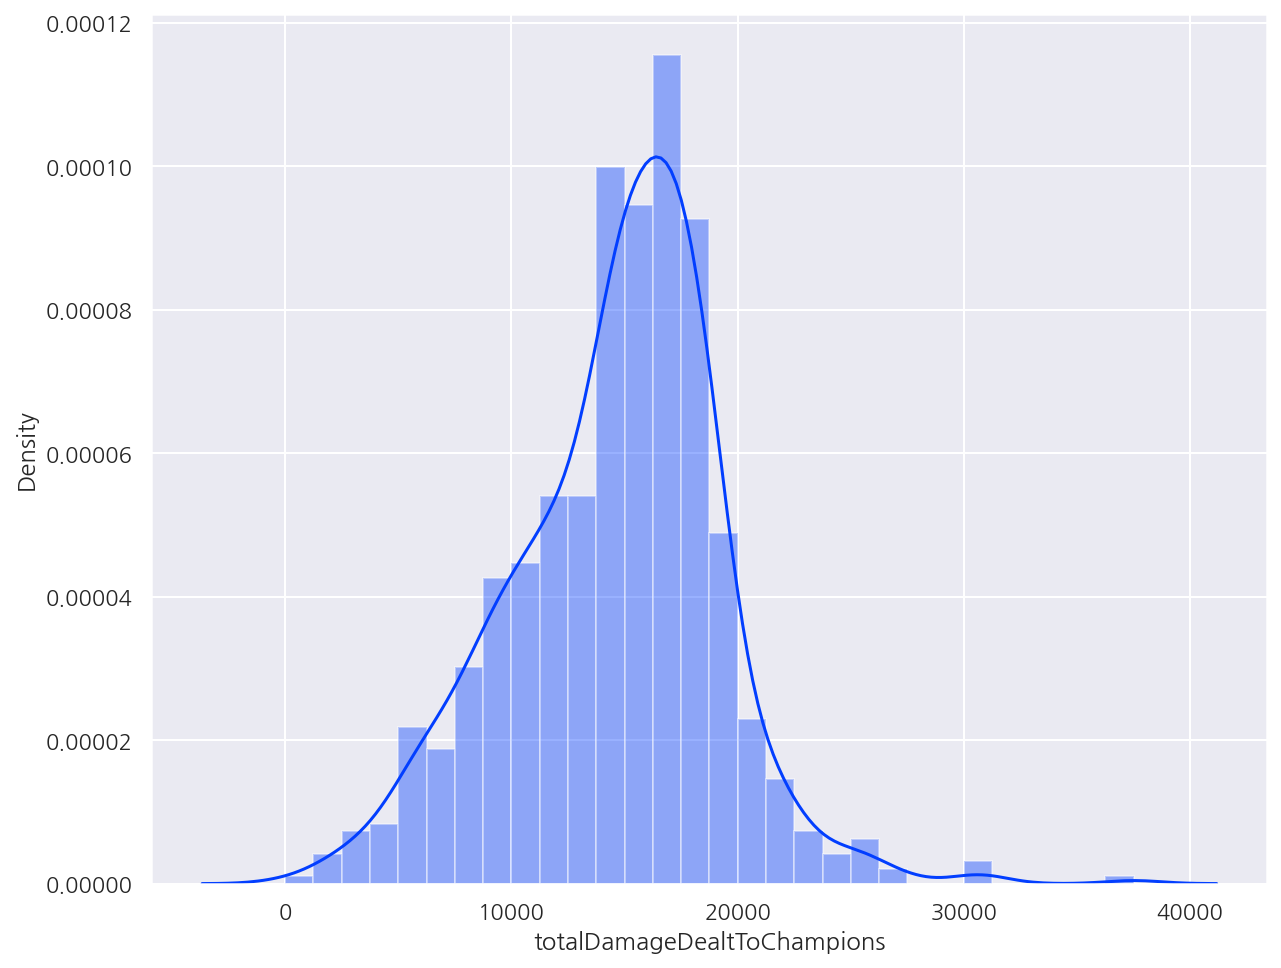
# distplot
group_data = data[data['gameLength']>200].groupby(['position','championId'], as_index=False).mean()
# sns.distplot(group_data, x='totalDamageDealtToChampions', hue='position')
sns.distplot(group_data['totalDamageDealtToChampions'])
plt.show()
# displot
# distplot은 figure size가 안먹혀서 displot으로 heigt, aspect로 설정가능
sns.displot(group_data['totalDamageDealtToChampions'], height=4, aspect=2)
plt.show()
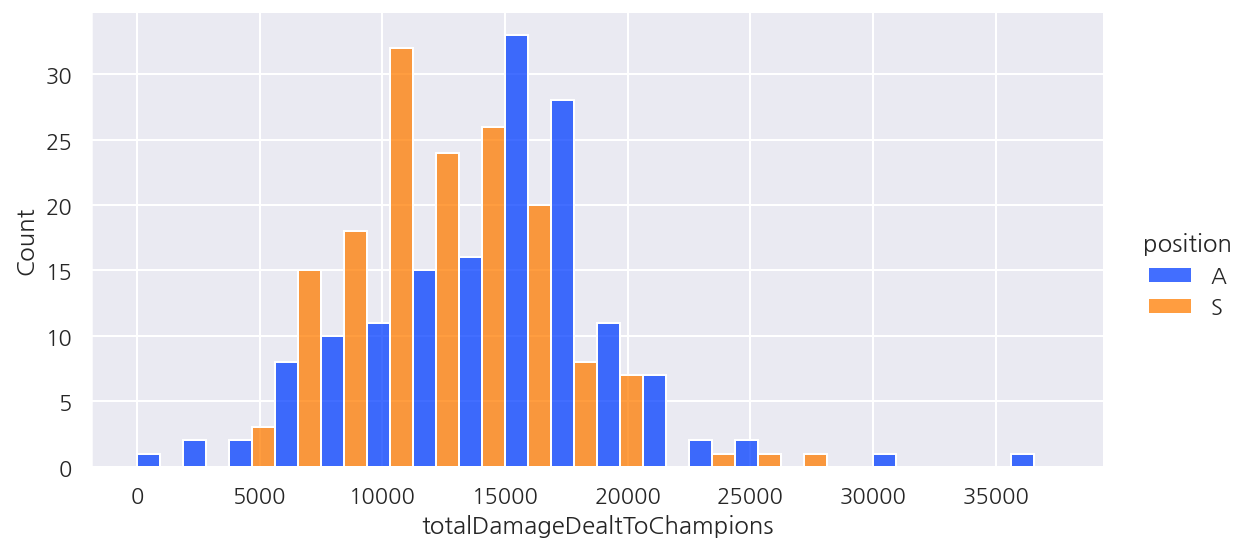
# displot
sns.displot(group_data[group_data['position'].isin(['A','S'])],
            x = 'totalDamageDealtToChampions', hue='position', multiple='dodge', height=4, aspect=2)
plt.show()
# 챔피언별 level당 stat 정보 등
champ_stats = pd.read_csv('Day09_01_champ_stats.csv')
champ_stats
| championId | championName | versionIndex | version | hp | hpperlevel | mp | mpperlevel | movespeed | armor | ... | attackspeed | hp_18 | mp_18 | armor_18 | spellblock_18 | hpregen_18 | mpregen_18 | crit_18 | attackdamage_18 | attackspeed_18 | |
|---|---|---|---|---|---|---|---|---|---|---|---|---|---|---|---|---|---|---|---|---|---|
| 0 | 1 | Annie | 11.17 | 11.17.394.4489 | 524.0 | 88 | 418.0 | 25.0 | 335 | 19 | ... | 0.579 | 2020.0 | 843.0 | 87.00 | 38.50 | 14.85 | 21.60 | 0 | 94.71 | 0.7129 |
| 1 | 2 | Olaf | 11.17 | 11.17.394.4489 | 575.0 | 100 | 316.0 | 42.0 | 350 | 35 | ... | 0.694 | 2275.0 | 1030.0 | 86.00 | 53.25 | 23.80 | 17.70 | 0 | 127.50 | 1.0125 |
| 2 | 3 | Galio | 11.17 | 11.17.394.4489 | 562.0 | 112 | 500.0 | 40.0 | 335 | 24 | ... | 0.625 | 2466.0 | 1180.0 | 83.50 | 53.25 | 21.60 | 21.40 | 0 | 118.50 | 0.7844 |
| 3 | 4 | TwistedFate | 11.17 | 11.17.394.4489 | 534.0 | 94 | 333.0 | 39.0 | 330 | 21 | ... | 0.651 | 2132.0 | 996.0 | 74.55 | 38.50 | 15.70 | 21.60 | 0 | 108.10 | 1.0074 |
| 4 | 5 | XinZhao | 11.17 | 11.17.394.4489 | 570.0 | 92 | 274.0 | 55.0 | 345 | 35 | ... | 0.645 | 2134.0 | 1209.0 | 94.50 | 53.25 | 19.90 | 14.91 | 0 | 114.00 | 1.0288 |
| ... | ... | ... | ... | ... | ... | ... | ... | ... | ... | ... | ... | ... | ... | ... | ... | ... | ... | ... | ... | ... | ... |
| 151 | 555 | Pyke | 11.17 | 11.17.394.4489 | 600.0 | 90 | 415.0 | 50.0 | 330 | 45 | ... | 0.667 | 2130.0 | 1265.0 | 104.50 | 53.25 | 15.50 | 25.00 | 0 | 96.00 | 0.9505 |
| 152 | 777 | Yone | 11.17 | 11.17.394.4489 | 550.0 | 85 | 500.0 | 0.0 | 345 | 28 | ... | 0.625 | 1995.0 | 500.0 | 85.80 | 53.25 | 20.25 | 0.00 | 0 | 94.00 | 0.9969 |
| 153 | 875 | Sett | 11.17 | 11.17.394.4489 | 600.0 | 93 | 0.0 | 0.0 | 340 | 33 | ... | 0.625 | 2181.0 | 0.0 | 101.00 | 53.25 | 15.50 | 0.00 | 0 | 128.00 | 0.8109 |
| 154 | 876 | Lillia | 11.17 | 11.17.394.4489 | 580.0 | 90 | 410.0 | 50.0 | 330 | 22 | ... | 0.625 | 2110.0 | 1260.0 | 90.00 | 44.75 | 20.25 | 27.65 | 0 | 113.70 | 0.9119 |
| 155 | 887 | Gwen | 11.17 | 11.17.394.4489 | 550.0 | 90 | 330.0 | 40.0 | 340 | 39 | ... | 0.690 | 2080.0 | 1010.0 | 107.00 | 53.25 | 16.35 | 19.40 | 0 | 114.00 | 0.9539 |
156 rows × 33 columns
# scatterplot
sns.scatterplot(data=champ_stats, x='hp', y='hp_18')
plt.show()

champ_stats.columns
Index(['championId', 'championName', 'versionIndex', 'version', 'hp',
       'hpperlevel', 'mp', 'mpperlevel', 'movespeed', 'armor', 'armorperlevel',
       'spellblock', 'spellblockperlevel', 'attackrange', 'hpregen',
       'hpregenperlevel', 'mpregen', 'mpregenperlevel', 'crit', 'critperlevel',
       'attackdamage', 'attackdamageperlevel', 'attackspeedperlevel',
       'attackspeed', 'hp_18', 'mp_18', 'armor_18', 'spellblock_18',
       'hpregen_18', 'mpregen_18', 'crit_18', 'attackdamage_18',
       'attackspeed_18'],
      dtype='object')
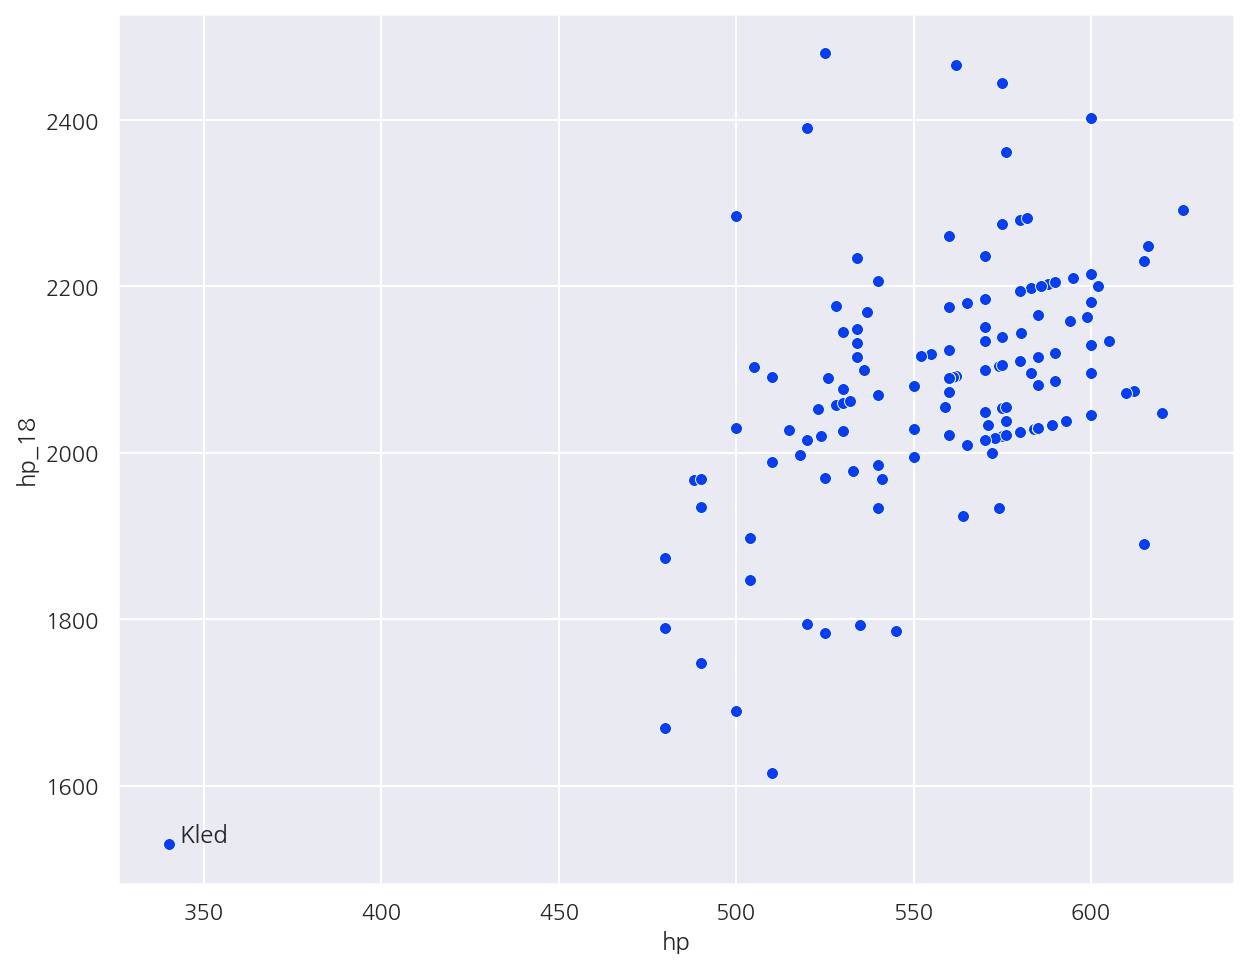
# text 삽입
sns.scatterplot(data=champ_stats, x='hp', y='hp_18')

plt.text(x = champ_stats[champ_stats['championName'] == 'Kled']['hp'] + 3,
         y = champ_stats[champ_stats['championName'] == 'Kled']['hp_18'] + 3,
         s = 'Kled')

plt.show()
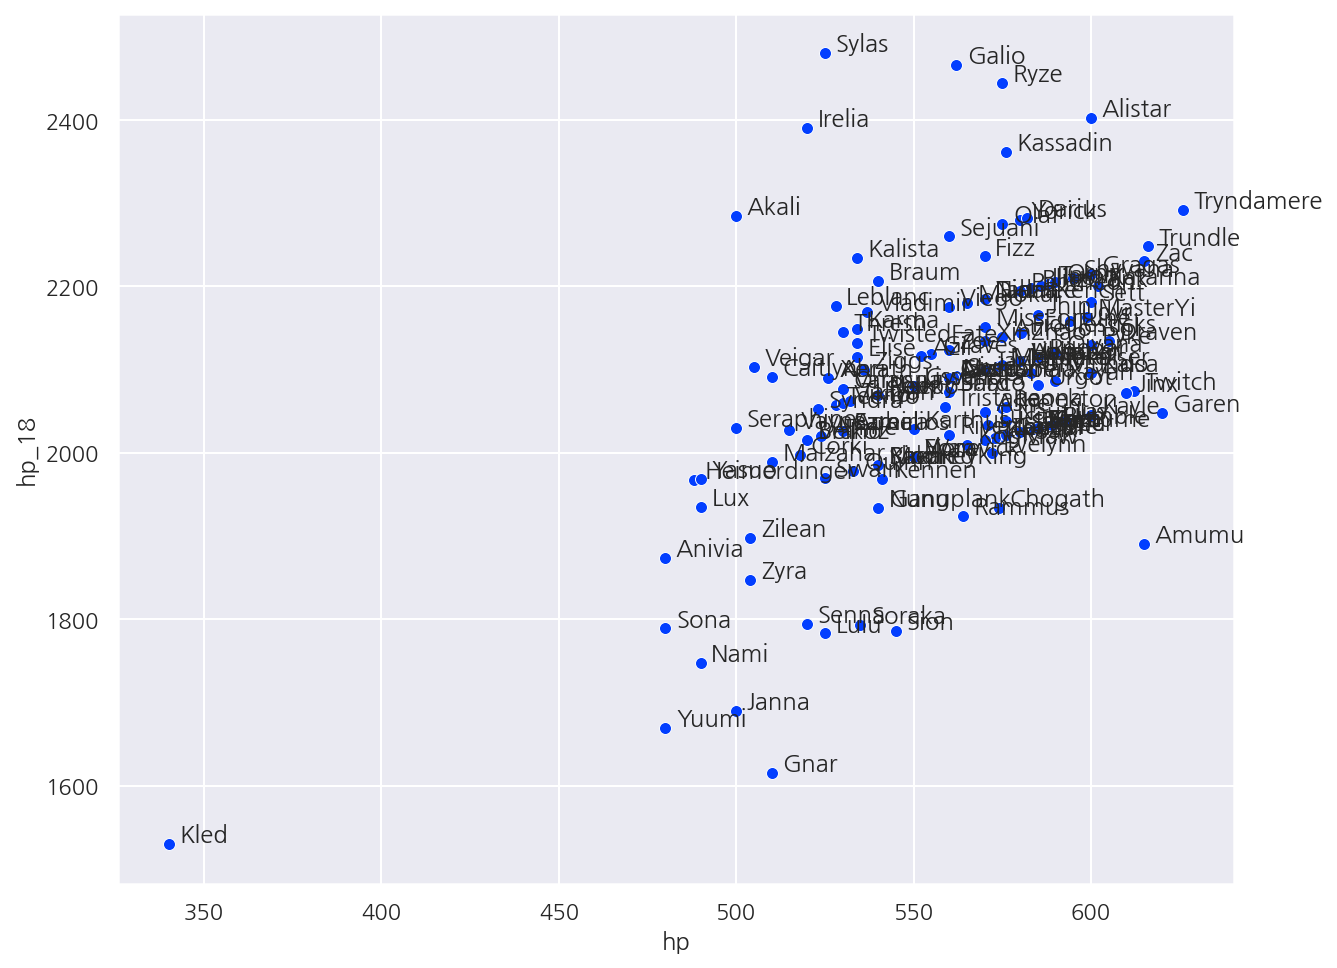
# 모든 챔피언 이름 넣기
sns.scatterplot(data=champ_stats, x='hp', y='hp_18')

for name in champ_stats['championName'].values:
    plt.text(x = champ_stats[champ_stats['championName'] == name]['hp'] + 3,
             y = champ_stats[champ_stats['championName'] == name]['hp_18'] + 3,
             s = name)

plt.show()
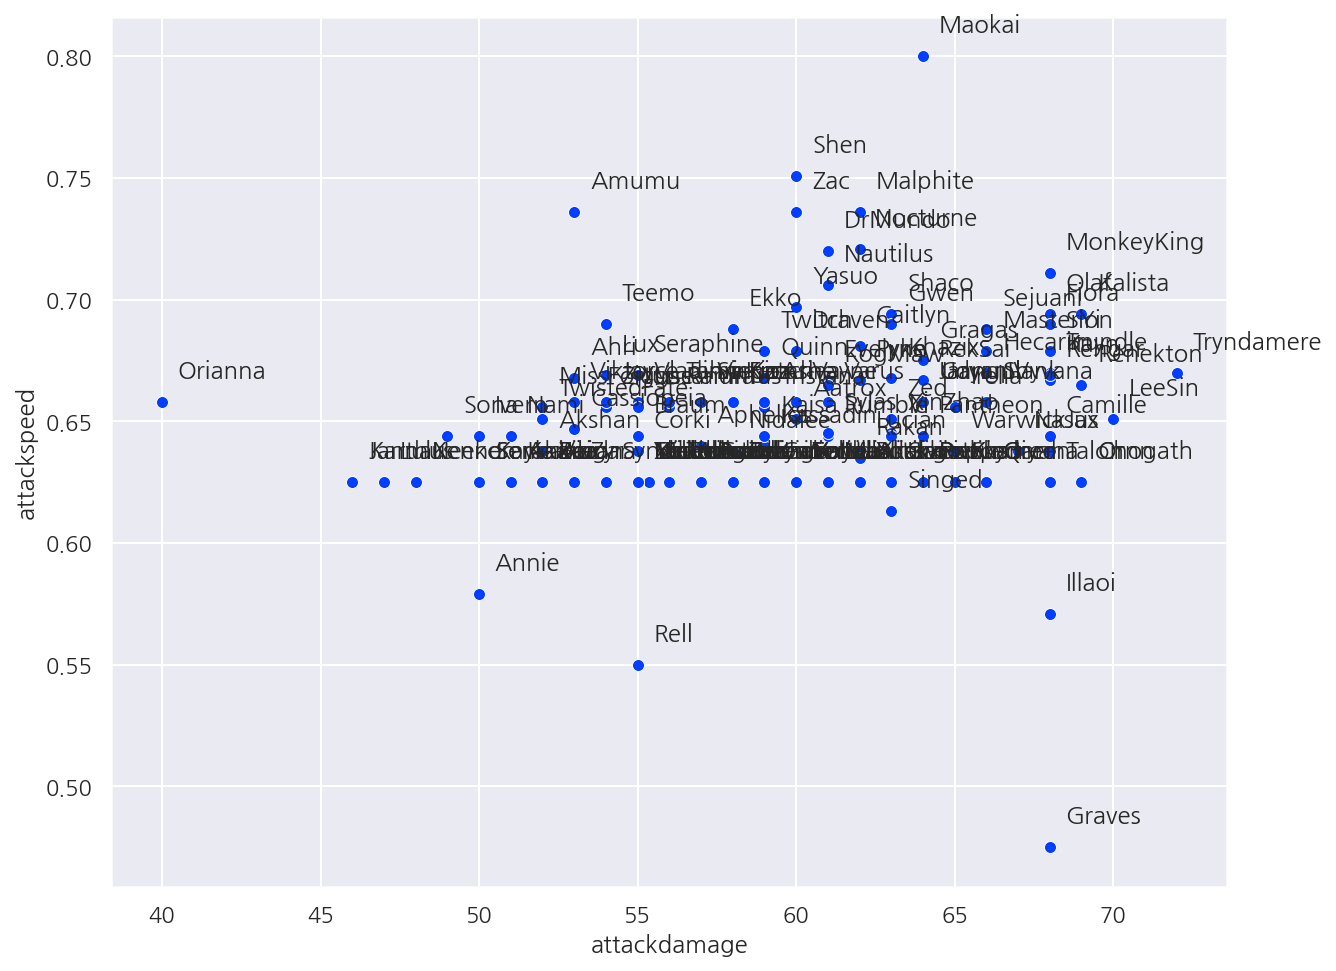
# 공격력과 공격속도
sns.scatterplot(data=champ_stats, x='attackdamage', y='attackspeed')

for name in champ_stats['championName'].values:
    plt.text(x = champ_stats[champ_stats['championName'] == name]['attackdamage'] + 0.5,
             y = champ_stats[champ_stats['championName'] == name]['attackspeed'] + 0.01,
             s = name)

plt.show()
2. 함수 정의 및 apply
# sample data
data = pd.DataFrame([[1,2,3,4], [5,6,7,8], [9,8,7,6]],
                    index = ['a', 'b', 'c'], columns = ["A", "B", "C", "D"])
data
| A | B | C | D | |
|---|---|---|---|---|
| a | 1 | 2 | 3 | 4 |
| b | 5 | 6 | 7 | 8 |
| c | 9 | 8 | 7 | 6 |
# 열 단위
data.apply(np.mean, axis=0)
A    5.000000
B    5.333333
C    5.666667
D    6.000000
dtype: float64
# 행 단위
data.apply(np.mean, axis=1)
a    2.5
b    6.5
c    7.5
dtype: float64
# exponential
data.apply(np.exp)
| A | B | C | D | |
|---|---|---|---|---|
| a | 2.718282 | 7.389056 | 20.085537 | 54.598150 |
| b | 148.413159 | 403.428793 | 1096.633158 | 2980.957987 |
| c | 8103.083928 | 2980.957987 | 1096.633158 | 403.428793 |
data.apply(lambda x: x["A"] + x["B"], axis=1)
a     3
b    11
c    17
dtype: int64
data.apply(lambda x: x["a"] + x["c"], axis=0)
A    10
B    10
C    10
D    10
dtype: int64
# 함수 이용
def multiply_2(x):
    return x*2

data.apply(lambda x: multiply_2(x))
| A | B | C | D | |
|---|---|---|---|---|
| a | 2 | 4 | 6 | 8 |
| b | 10 | 12 | 14 | 16 |
| c | 18 | 16 | 14 | 12 |
# 함수 이용2
def hello(x):
    return 'hello my name is ' + x

hello("Me")
'hello my name is Me'
data = pd.read_csv("Day09_01_BIPA_data.csv", index_col=0)
data
| gameId | createDate | tierRank | position | teamId | summonerId | championId | result | level | championsKilled | ... | totalDamageTaken | neutralMinionsKilledEnemyJungle | neutralMinionsKilledTeamJungle | visionScore | damageSelfMitigated | damageDealtToObjectives | damageDealtToTurrets | lane | gameLength | version | |
|---|---|---|---|---|---|---|---|---|---|---|---|---|---|---|---|---|---|---|---|---|---|
| 0 | 5383880006 | 2021-08-11 06:59:31 | P318 | S | 200 | 3210877 | 99 | WIN | 10 | 4 | ... | 3602 | 0 | 0 | 11 | 2830 | 2181 | 2181 | NONE | 972 | 11.16.390.1945 |
| 1 | 5383880006 | 2021-08-11 06:59:31 | P466 | S | 100 | 7550211 | 35 | LOSE | 8 | 1 | ... | 5077 | 0 | 2 | 24 | 2013 | 0 | 0 | NONE | 972 | 11.16.390.1945 |
| 2 | 5383880006 | 2021-08-11 06:59:31 | P329 | M | 200 | 9306696 | 266 | WIN | 11 | 5 | ... | 11029 | 0 | 0 | 15 | 6158 | 585 | 585 | NONE | 972 | 11.16.390.1945 |
| 3 | 5383880006 | 2021-08-11 06:59:31 | P461 | T | 200 | 20281103 | 92 | WIN | 11 | 8 | ... | 9944 | 0 | 0 | 10 | 7615 | 2318 | 2318 | NONE | 972 | 11.16.390.1945 |
| 4 | 5383880006 | 2021-08-11 06:59:31 | P30 | A | 200 | 26082075 | 22 | WIN | 10 | 3 | ... | 6387 | 0 | 0 | 13 | 3218 | 2370 | 2370 | NONE | 972 | 11.16.390.1945 |
| ... | ... | ... | ... | ... | ... | ... | ... | ... | ... | ... | ... | ... | ... | ... | ... | ... | ... | ... | ... | ... | ... |
| 999995 | 5384659633 | 2021-08-11 17:20:44 | S146 | S | 100 | 21560397 | 53 | WIN | 15 | 1 | ... | 32961 | 0 | 0 | 63 | 34725 | 1978 | 126 | BOTTOM | 2379 | 11.16.390.1945 |
| 999996 | 5384659633 | 2021-08-11 17:20:44 | G442 | M | 100 | 46320531 | 166 | WIN | 18 | 10 | ... | 24674 | 1 | 16 | 16 | 21371 | 8406 | 7042 | MIDDLE | 2379 | 11.16.390.1945 |
| 999997 | 5384659633 | 2021-08-11 17:20:44 | G418 | J | 200 | 64820251 | 64 | LOSE | 17 | 5 | ... | 45911 | 6 | 68 | 22 | 62426 | 20292 | 454 | JUNGLE | 2379 | 11.16.390.1945 |
| 999998 | 5384659633 | 2021-08-11 17:20:44 | S178 | A | 100 | 72310857 | 81 | WIN | 17 | 6 | ... | 28187 | 8 | 9 | 17 | 19664 | 11090 | 1062 | BOTTOM | 2379 | 11.16.390.1945 |
| 999999 | 5384659633 | 2021-08-11 17:20:44 | G456 | T | 100 | 72520226 | 875 | WIN | 18 | 3 | ... | 54999 | 0 | 9 | 30 | 64441 | 13682 | 9331 | TOP | 2379 | 11.16.390.1945 |
1000000 rows × 37 columns
# 첫 글자 가져오기
data["tierRank"].str[:1]
0         P
1         P
2         P
3         P
4         P
         ..
999995    S
999996    G
999997    G
999998    S
999999    G
Name: tierRank, Length: 1000000, dtype: object
# 첫 글자 가져오기 apply
# data["tierRank"].apply(lambda x: x[0])
- 실행시 결측 값이 존재해서 float형태로 입력되어 있기에 인덱싱이 안됨(문자열 x)
sns.heatmap(data.isnull(), cbar=False)
plt.show()
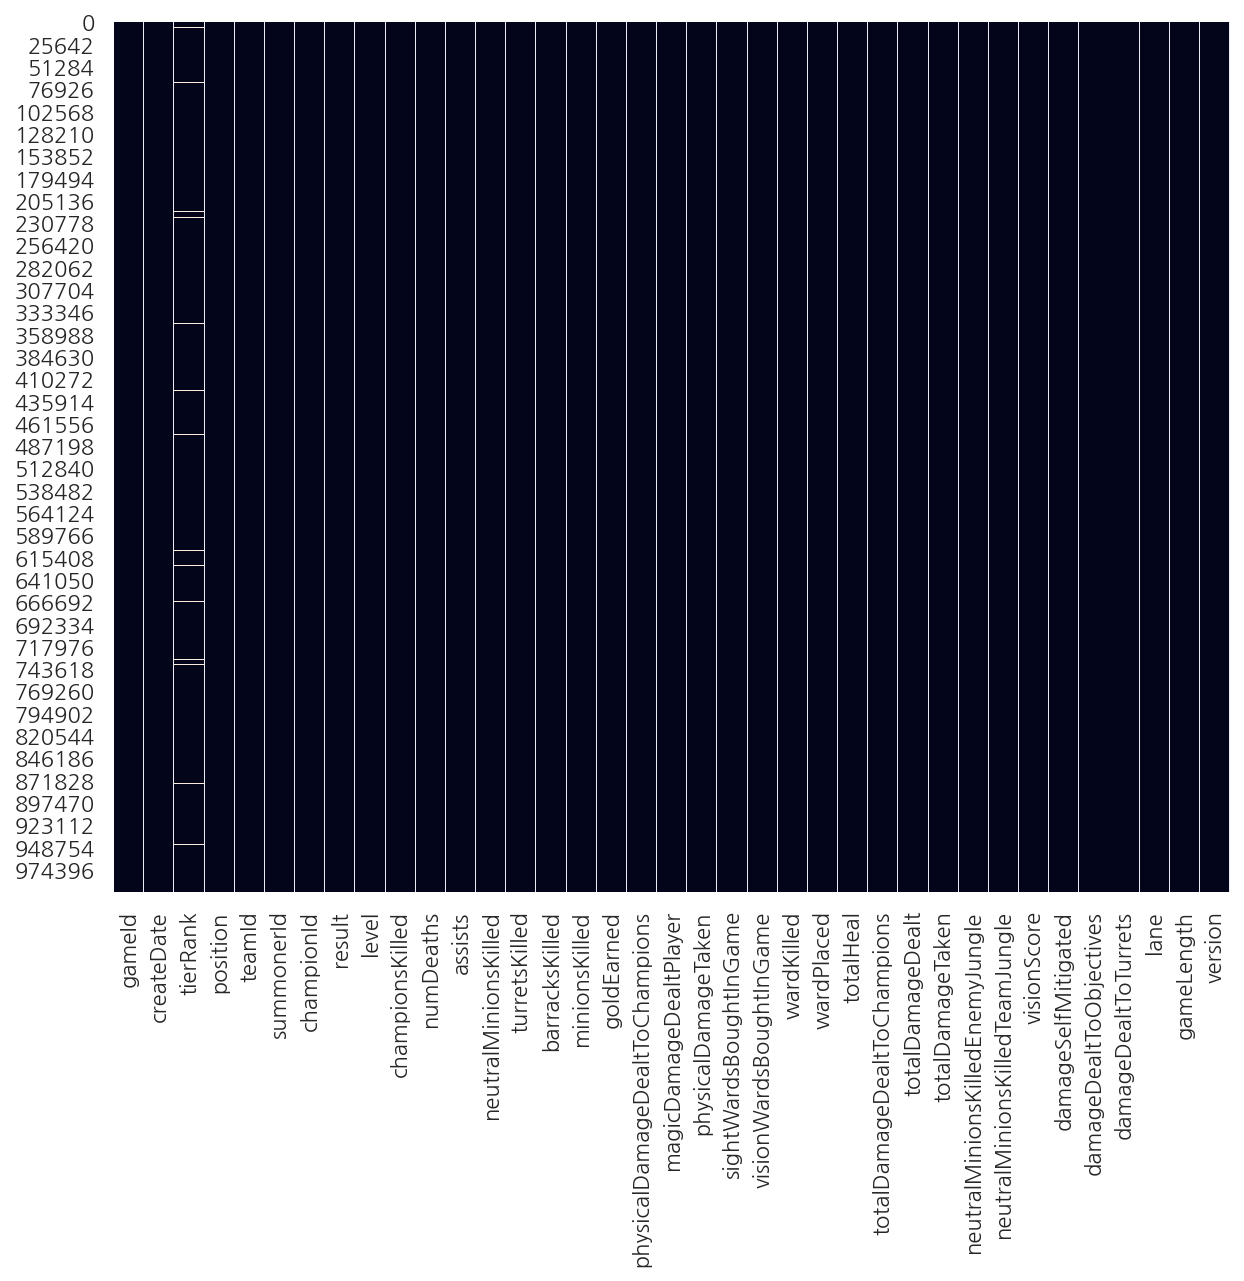
# missingno 패키지 사용
import missingno as msno

msno.bar(data)
<AxesSubplot:>
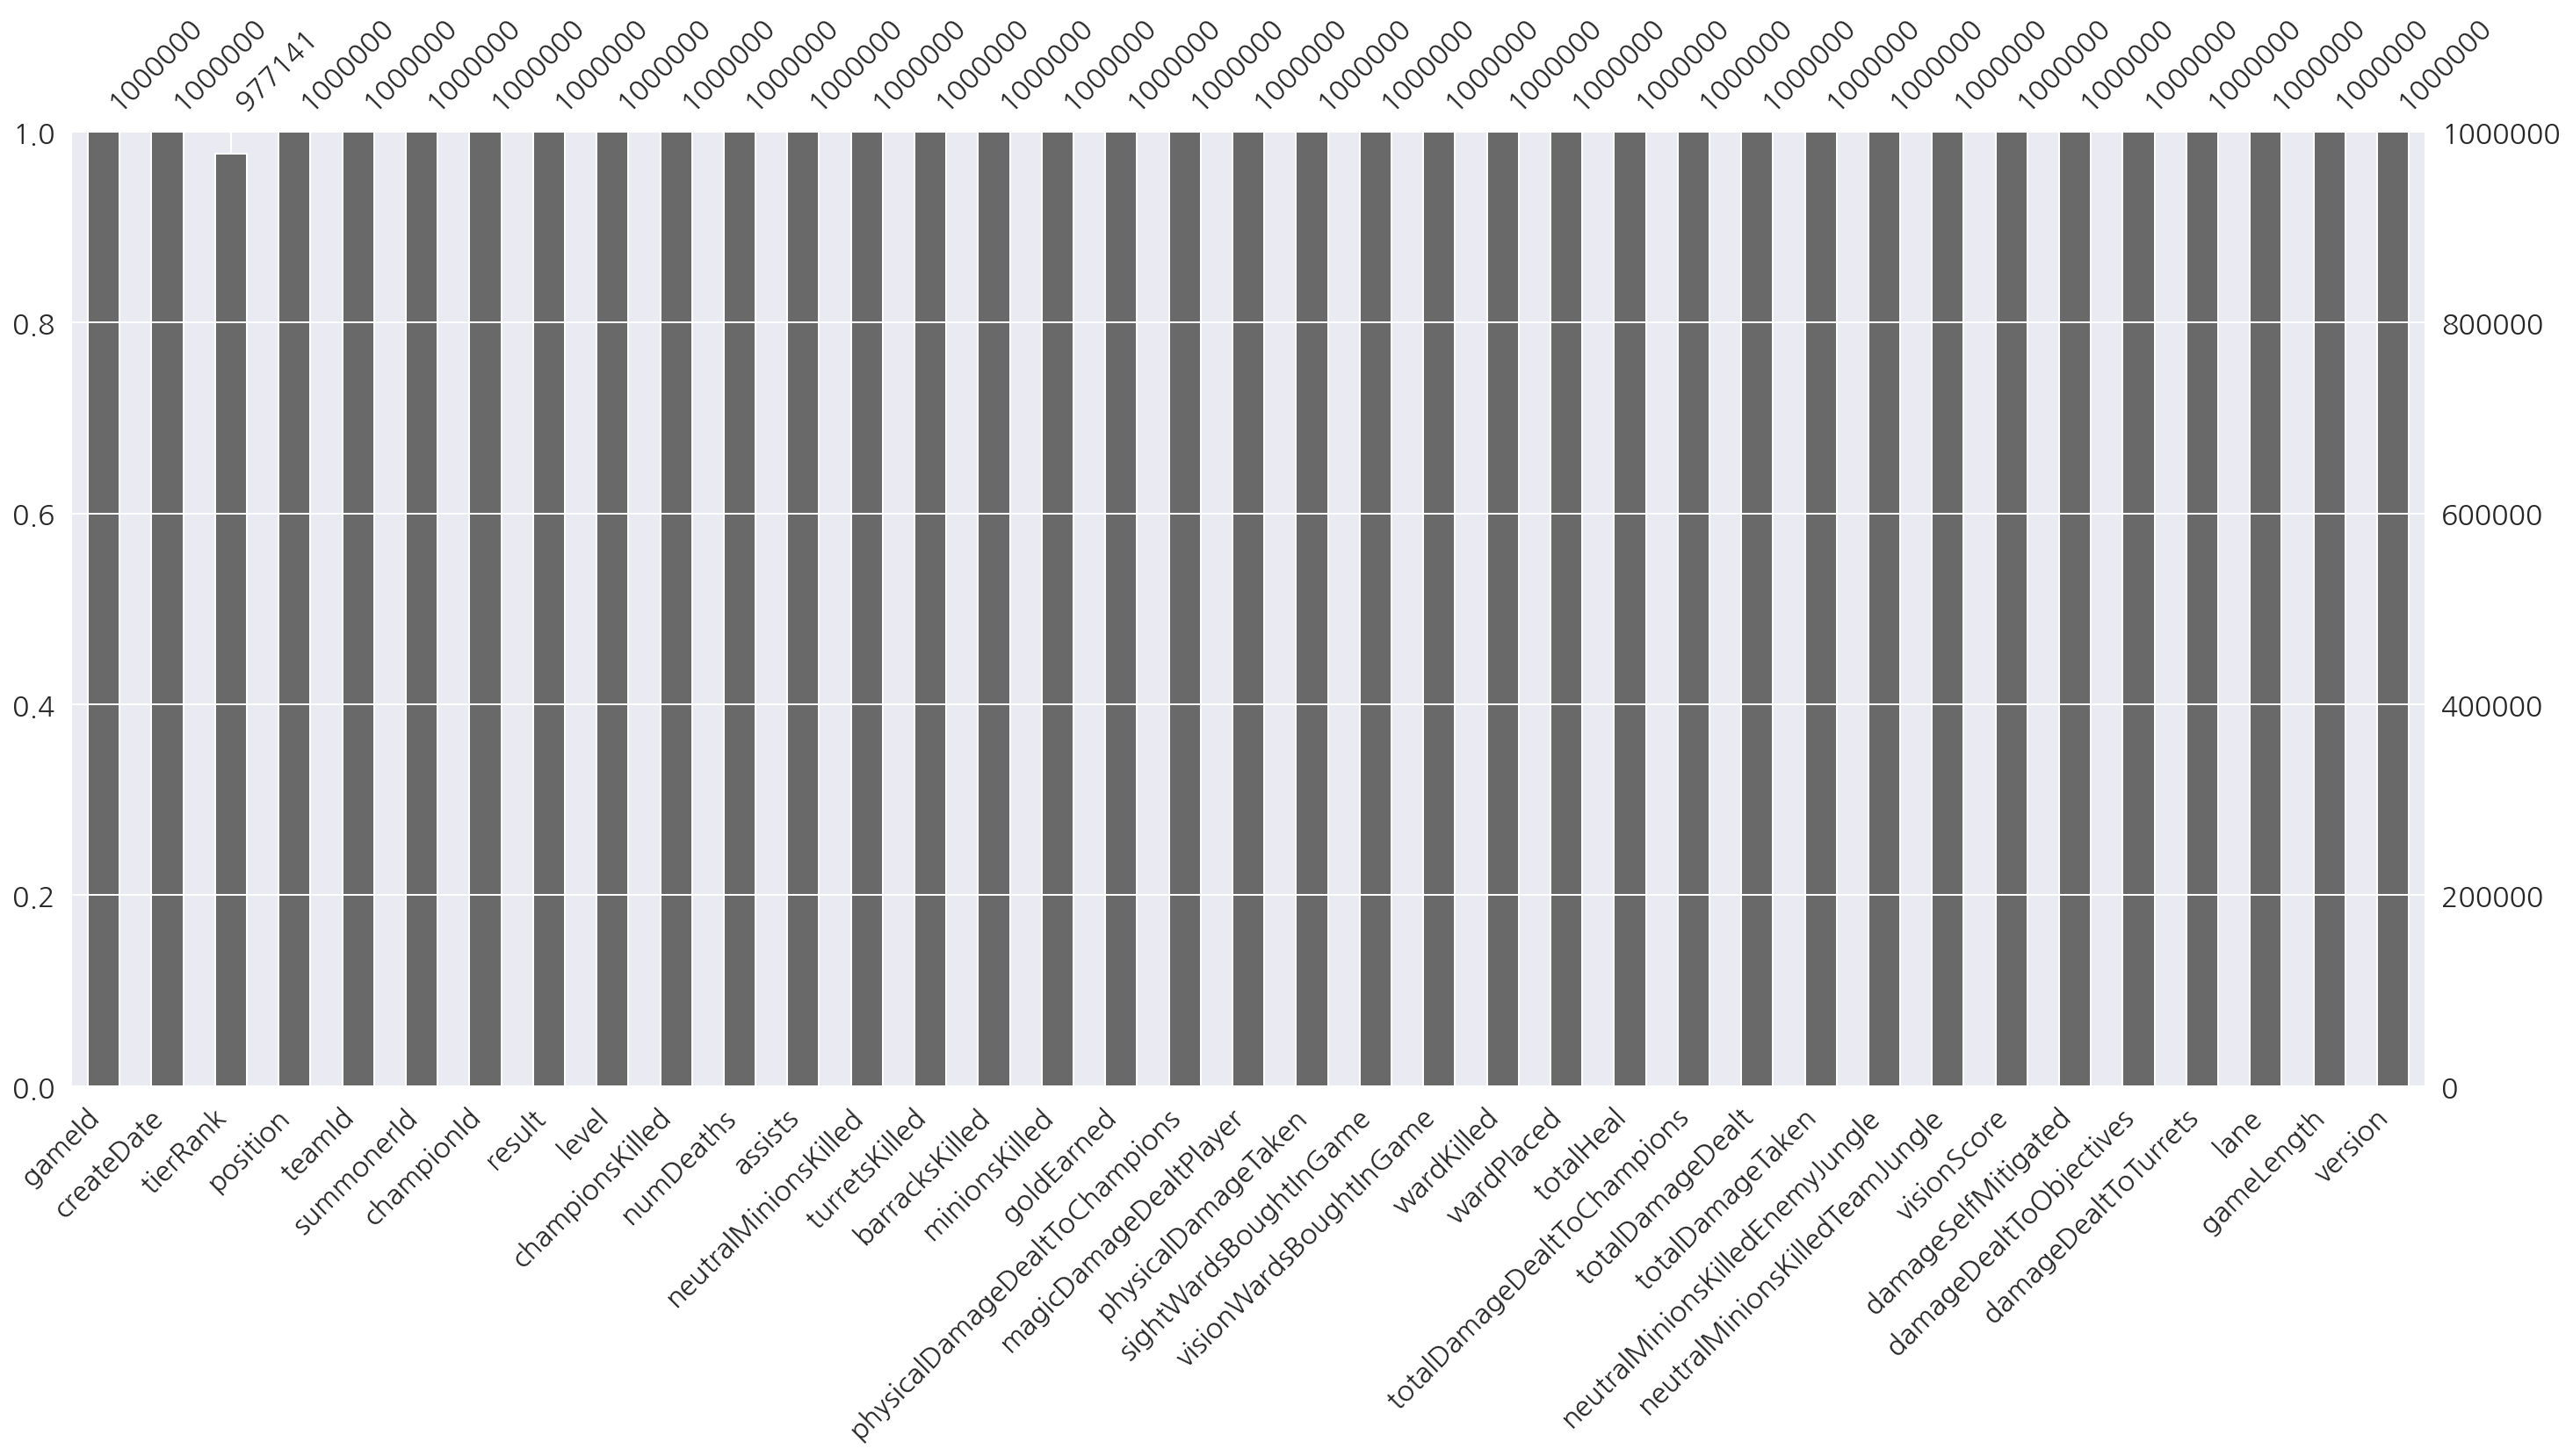
- tierRank에 결측값 존재하는 것 확인 가능
# 결측값 제거
data1 = data[data["tierRank"].notnull()].copy()
# 첫 글자 가져오기 apply
data1["tier"] = data1["tierRank"].apply(lambda x: x[0])
- 이제 float형태가 아니므로 잘 적용된다.
# 특정 문자가 있는지
data1[data1["tierRank"].str.contains("C")]
| gameId | createDate | tierRank | position | teamId | summonerId | championId | result | level | championsKilled | ... | neutralMinionsKilledEnemyJungle | neutralMinionsKilledTeamJungle | visionScore | damageSelfMitigated | damageDealtToObjectives | damageDealtToTurrets | lane | gameLength | version | tier | |
|---|---|---|---|---|---|---|---|---|---|---|---|---|---|---|---|---|---|---|---|---|---|
| 36518 | 5383988789 | 2021-08-11 11:21:27 | C1907 | T | 200 | 86094085 | 39 | WIN | 16 | 6 | ... | 1 | 1 | 26 | 21058 | 13819 | 10387 | TOP | 1592 | 11.16.390.1945 | C |
| 205196 | 5384285152 | 2021-08-11 12:34:20 | C1819 | J | 100 | 87214832 | 234 | LOSE | 12 | 2 | ... | 1 | 101 | 34 | 16263 | 4647 | 0 | JUNGLE | 1531 | 11.16.390.1945 | C |
| 206972 | 5384286004 | 2021-08-11 12:43:57 | C1868 | J | 100 | 41780873 | 68 | WIN | 15 | 12 | ... | 20 | 100 | 37 | 17796 | 32194 | 1021 | JUNGLE | 1612 | 11.16.390.1945 | C |
| 210966 | 5384288138 | 2021-08-11 13:09:53 | C1906 | M | 100 | 86094085 | 13 | WIN | 18 | 8 | ... | 12 | 15 | 31 | 11095 | 26446 | 8164 | TOP | 1859 | 11.16.390.1945 | C |
| 210969 | 5384288138 | 2021-08-11 13:09:53 | C1843 | T | 200 | 87299019 | 150 | LOSE | 17 | 5 | ... | 0 | 3 | 26 | 27323 | 5388 | 0 | TOP | 1859 | 11.16.390.1945 | C |
| ... | ... | ... | ... | ... | ... | ... | ... | ... | ... | ... | ... | ... | ... | ... | ... | ... | ... | ... | ... | ... | ... |
| 944443 | 5384634868 | 2021-08-11 16:27:29 | C1836 | J | 200 | 84679870 | 234 | LOSE | 10 | 2 | ... | 17 | 58 | 20 | 8843 | 12620 | 0 | NONE | 1148 | 11.16.390.1945 | C |
| 950550 | 5384637692 | 2021-08-11 16:57:07 | C1918 | J | 100 | 6300872 | 131 | WIN | 16 | 5 | ... | 20 | 100 | 20 | 19966 | 43562 | 2366 | JUNGLE | 1774 | 11.16.390.1945 | C |
| 950551 | 5384637692 | 2021-08-11 16:57:07 | C1857 | S | 200 | 13583512 | 48 | LOSE | 13 | 2 | ... | 0 | 0 | 70 | 20091 | 2733 | 1103 | BOTTOM | 1774 | 11.16.390.1945 | C |
| 950554 | 5384637692 | 2021-08-11 16:57:07 | C1864 | M | 200 | 79280308 | 7 | LOSE | 17 | 19 | ... | 0 | 16 | 32 | 13141 | 10980 | 8699 | MIDDLE | 1774 | 11.16.390.1945 | C |
| 950557 | 5384637692 | 2021-08-11 16:57:07 | C1806 | T | 200 | 87299019 | 223 | LOSE | 14 | 3 | ... | 0 | 0 | 16 | 55072 | 4999 | 2161 | TOP | 1774 | 11.16.390.1945 | C |
211 rows × 38 columns
data1["tier"].value_counts()
S    350067
G    332395
B    127999
P    125914
D     26826
I     10052
M      2965
R       712
C       211
Name: tier, dtype: int64
# 티어별 카테고리 생성
data1["tier_category"] = data1['tier'].apply(lambda x: 1 if x=="I"
                                             else 2 if x=="B"
                                             else 3 if x=="S"
                                             else 4 if x=="G"
                                             else 5 if x=="P"
                                             else 6 if x=="D"
                                             else 7 if x=="M"
                                             else 8 if x=="R"
                                             else 9 if x=="C"
                                             else 0)
data1[["tier", "tier_category"]]
| tier | tier_category | |
|---|---|---|
| 0 | P | 5 |
| 1 | P | 5 |
| 2 | P | 5 |
| 3 | P | 5 |
| 4 | P | 5 |
| ... | ... | ... |
| 999995 | S | 3 |
| 999996 | G | 4 |
| 999997 | G | 4 |
| 999998 | S | 3 |
| 999999 | G | 4 |
977141 rows × 2 columns
# 티어별 카테고리 생성 2
def tier_category_function(x):
    if x=="I":
        return 1
    if x=="B":
        return 2
    if x=="S":
        return 3
    if x=="G":
        return 4
    if x=="P":
        return 5
    if x=="D":
        return 6
    if x=="M":
        return 7
    if x=="R":
        return 8
    if x=="C":
        return 9
data1["tier_category2"] = data1['tier'].apply(lambda x: tier_category_function(x))
len(data1["tier_category"] == data1["tier_category2"])
977141
# 내가 만든 함수 불러오기
from Day09_01_module import champion_load
champion_load()
| champion | |
|---|---|
| 266 | Aatrox |
| 103 | Ahri |
| 84 | Akali |
| 166 | Akshan |
| 12 | Alistar |
| ... | ... |
| 238 | Zed |
| 115 | Ziggs |
| 26 | Zilean |
| 142 | Zoe |
| 143 | Zyra |
156 rows × 1 columns
- 미리 만들어둔 Day09_01_module 파일에 champion_load 함수를 불러와 사용하였다.
3. 와드와 승률의 상관관계
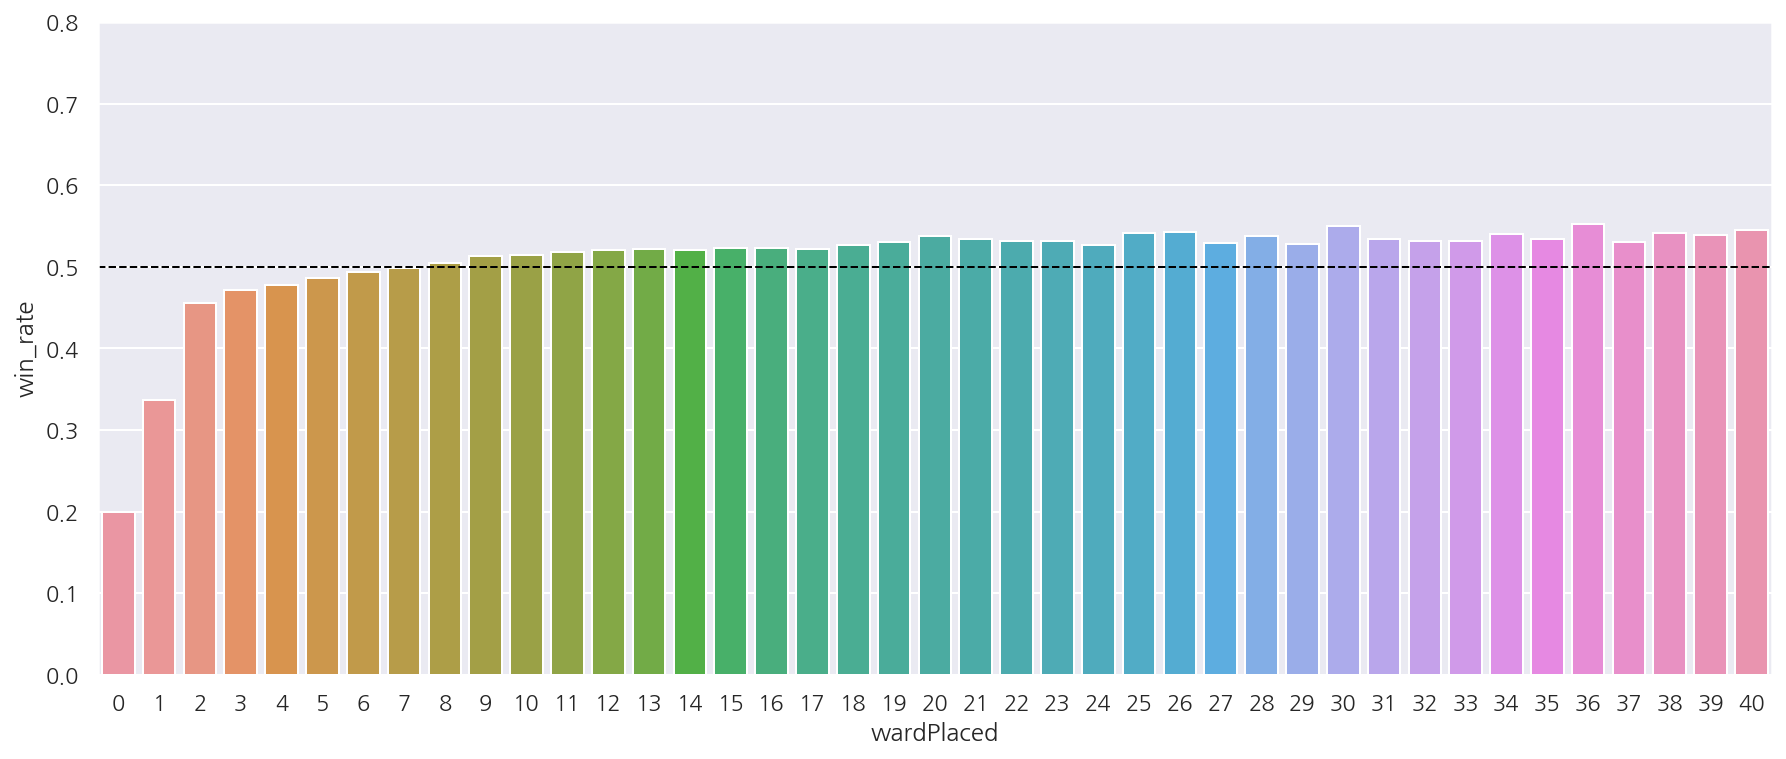
# 승리여부 1,0으로 변환
data_me = data[["wardPlaced", "result"]]
data_me["result"] = data_me["result"].apply(lambda x: 1 if x=="WIN" else 0)
# 승률 계산
def count_sum(x):
    win_rate = x['result'].sum() / x['result'].count()

    return pd.Series(win_rate, index=["win_rate"])

temp = data_me.groupby("wardPlaced", as_index=False).apply(count_sum)
# 와드수 40개 이하만
temp_ward40 = temp[temp["wardPlaced"] <= 40]

# bar chart
fig, axs = plt.subplots(1,1, figsize=(15,6))

sns.barplot(data = temp_ward40, x = "wardPlaced", y = "win_rate", ci = None, ax= axs)
axs.axhline(0.5, ls='--', lw=1, color='black')
axs.set_ylim(0,0.8)

plt.show()
Leave a comment